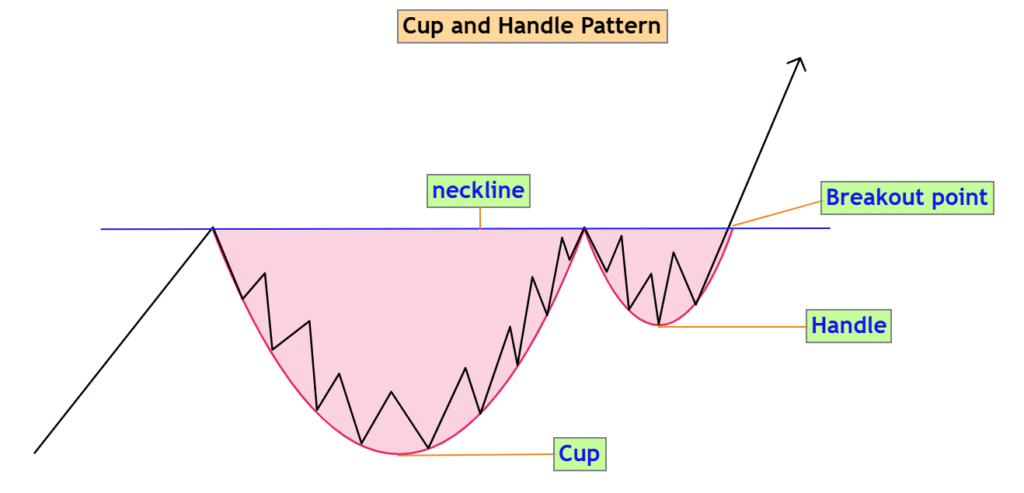
Cup and Handle Pattern

Trading is more than just buying low and selling high; it’s about making decisions with structure and confidence. Successful traders rely on clear strategies, not guesses, to navigate markets.
That’s where technical analysis comes in. By studying price charts, volume, and patterns, traders can spot repeatable setups with strong potential.
Among these, chart patterns are especially valuable for identifying continuation and reversal opportunities. One pattern that has stood the test of time is the cup and handle.
First popularized by William J. O’Neil in his book How to Make Money in Stocks, the cup and handle pattern remains a reliable bullish signal when used correctly. It offers well-defined entry points, clear risk management, and measurable profit targets, making it a favorite among swing and long-term traders alike.
What Is the Cup and Handle Pattern?
The cup and handle pattern is a technical chart pattern that signals a potential upward trend. It begins with a cup formation, where the price forms a rounded bottom often resembling a "U" shape after a period of decline and recovery.
Next comes the handle, a brief consolidation period where the price drifts slightly downward or sideways, forming a narrow range. This handle pattern sets the stage for a breakout, ideally above the prior resistance level.
As a bullish continuation pattern, it suggests that the price is taking a breather before resuming its upward move. It can be useful in higher time frame charts like daily, weekly, and monthly, and it applies across stocks, forex, and crypto.
How to Identify a Cup and Handle Pattern
Correct identification is essential. A valid cup formation typically develops after a clear bullish trend, serving as a continuation pattern. In some cases, especially on higher time frames, it may also appear at the end of a downtrend, indicating a potential bullish reversal pattern. In both scenarios, the cup should have a smooth, rounded shape, not a sharp V, and it should not retrace more than 50 percent of the prior move.
The handle formation should remain within the upper third of the cup. It should slope gently downward or move sideways. If the handle dips too deeply or becomes erratic, the pattern loses reliability.
To confirm the setup, draw a horizontal neckline across the cup’s previous highs. A breakout and retest of this level often marks the beginning of a new upward leg. While volume is not always necessary, a rise in buying pressure during the breakout can strengthen the signal.
Entry Points, Stop Loss, and Profit Targets
Once the handle forms and a breakout begins, traders typically choose between three common entry strategies:
Breakout Entry Strategy:Enter when the price breaks above the handle’s resistance level. This is the most common approach, as it provides confirmation that bullish momentum is taking hold.
Early Entry Strategy:More aggressive traders may choose to enter while the handle is still forming, ideally near the low of the handle. While this allows for a better price, it also carries more risk if the pattern fails to complete.
Entry After Retest:Another method is to wait for a breakout above the neckline, followed by a retest. If the price respects the neckline as new support, this offers a more conservative and confirmation-based entry.
Stop Loss Placement:A common guideline is to place the stop loss just below the lowest point of the handle. This helps limit losses if the breakout fails and the pattern becomes invalid.
Profit Target Calculation:To set your target, measure the distance from the bottom of the cup to the resistance level (the neckline), then project that same distance upward from the breakout point. For example, if the cup depth is measured accurately, your target would be an equal distance above the breakout. If your stop loss is placed below the handle, this setup can offer a favorable risk-to-reward ratio, such as 2:1.
Some traders prefer to aim for a 3:1 risk-to-reward ratio, adjusting their take profit accordingly. While these targets offer greater profit potential, they may require more time to be reached, especially when trading on higher time frames.
Ready to trade smarter? Use the Top One Trader Position Size Calculator to determine the perfect lot size for every trade based on your stop loss level, account size, and the asset you want to trade.
Example: BTC/USD Cup and Handle Pattern Explained
Let’s take a look at how the cup and handle pattern plays out in a real scenario. Understanding the pattern visually and knowing how to trade it is what turns theory into results.
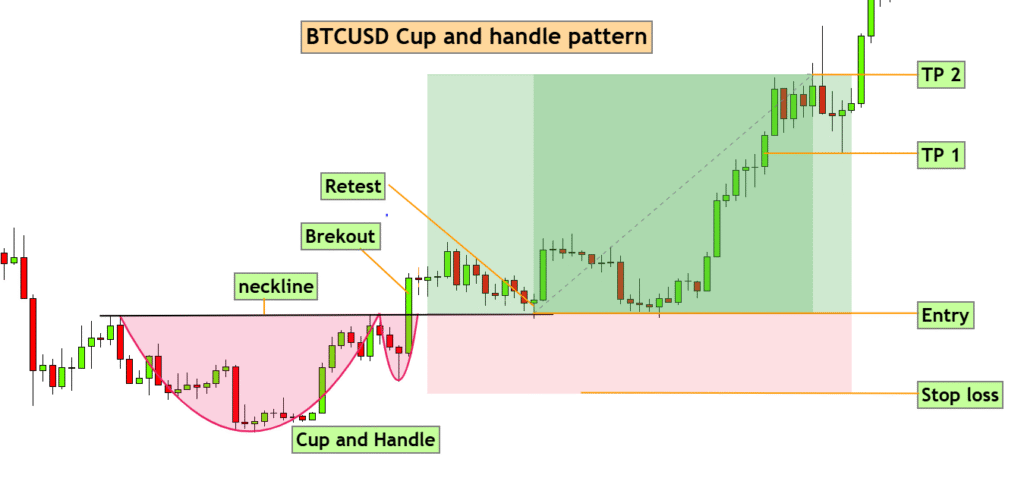
The chart above shows a bullish cup and handle pattern on BTC/USD. The setup begins with a rounded cup formation, where the market gradually recovers from a decline, forming a smooth U-shaped curve that reflects accumulation and a shift in sentiment.
Following the cup, a brief handle formation appears, characterized by a slight downward or sideways drift. This part of the handle pattern bullish structure indicates a short pause in upward momentum and a temporary drop in buying pressure before the next leg higher.
Entry, Stop Loss & Exit Points
- Entry Point: The trade is triggered when the price breaks and retests the neckline, confirming the breakout and providing a clear opportunity to enter with confidence.
- Stop Loss: Set just below the low of the handle to protect against unexpected reversals.
- Exit Points:
- TP1 aims for a 2:1 reward-to-risk ratio.
- TP2 targets a 3:1 reward-to-risk setup if the price continues to trend higher.

Common Variations and Inverted Patterns
The cup and handle pattern can appear across timeframes and asset classes, but it doesn't always look identical.
Intraday vs. Multi-Month Cups
On a 1-hour or 4-hour chart, the pattern might form and complete within a single trading day, offering quick opportunities for scalpers or day traders. These intraday cup and handle patterns are often more volatile but can yield strong moves if confirmed by volume and trend.
In contrast, multi-year cup and handle patterns form slowly over months or even years. These are favored by long-term investors or swing traders who aim to capture larger upward trends.
Inverted Cup and Handle (Bearish Setup)
The inverted cup and handle pattern flips the structure upside down. Instead of forming a rounded bottom, the price creates a rounded top, followed by a slight upward handle formation. This version acts as a bearish pattern.
If the price breaks below the handle’s support level on high volume, it may signal a downtrend. Traders use this setup to go short or exit long positions before further losses occur.
Avoiding False Setups
One of the biggest risks is trading invalid patterns. A few red flags include:
- The cup depth is too steep (more than 50% of the prior trend)
- The handle pattern is too wide or erratic
- The breakout point has low volume confirmation
- The price breaks out before the handle fully forms
In these cases, it’s better to stay patient. An incomplete or sloppy pattern often leads to failed breakouts, hurting your risk-to-reward ratio.
Limitations and Risk Management Tips
No pattern is perfect, and the cup and handle is no exception.
Why the Pattern Fails
The cup and handle pattern can fail for several reasons. Entering too early before a confirmed breakout is one of the most common mistakes, often leading to false breakouts. Low volume can also weaken the setup, especially in thinly traded markets where the price struggles to follow through.
Other causes include a cup that retraces too deeply, a handle that’s too wide or volatile, or breakouts that happen during sideways or unstable market conditions. Strong resistance above the neckline or ignoring confirmation from volume and candlestick patterns can also lead to failure.
How to Improve Your Success Rate
To trade the cup and handle pattern more effectively, focus on confirmation and structure. Wait for a confirmed breakout with supporting volume to reduce the risk of false signals. Place your stop loss just below the handle to protect against sudden reversals. Avoid trading this pattern against the trend or during periods of high market volatility, as these conditions can weaken its reliability. Using additional tools like RSI, moving averages, or other technical indicators can provide stronger confirmation. Finally, always adjust your position size according to your capital size. Consistent results come from disciplined execution, not just spotting the pattern.

Final Thoughts: Is the Cup and Handle Pattern Right for You?
The cup and handle is one of the most dependable patterns in technical analysis, offering traders a visual roadmap for potential trend continuation in a bullish trend. This formation begins with a rounded cup, followed by a brief consolidation phase known as the handle, that sets the stage for a breakout when price hits the neckline with conviction.
It can form in just a few hours, a few weeks, or even span over several years, making it useful for day trading, swing trading, and long-term investing. When supported by volume indicators and confirmation with candlestick patterns, the setup can provide high-probability entries with clearly defined risk and target price levels.
Still, it’s essential to remain cautious during market volatility and to watch for signs of weakening momentum or selling pressure. No pattern is foolproof, but the key to making it work lies in disciplined execution.
To succeed in trading and make better trading decisions, you should have a solid trading strategy, a strict risk management plan, and strong control over your emotions. When used as part of a structured system, the cup and handle can be a powerful signal that helps you trade with more clarity, confidence, and consistency.
Take your trading to the next level with Top One Trader. Get real-time dashboards, educational resources, trade analytics, and tailored challenges all designed to support your growth and strategy.
-1%201%20(1).webp)