Mastering Day Trading Patterns: A Practical Guide


Day trading is a fast-paced game of timing, precision, and quick decision-making. It’s not just about buying and selling, it’s about interpreting the market as a story unfolding in real time.
There are many trading strategies, along with numerous tools that can easily confuse traders, especially beginners. One of the most common and effective strategies is the use of chart patterns. These patterns have consistently proven their effectiveness across different markets, time frames, and periods.
Trading Chart patterns have been used in trading for over a century. Their use as a technical analysis tool dates back to the early 20th century, particularly through the work of Charles Dow, the founder of Dow Theory.
In this article, we’re going to discuss chart patterns, whether they’re reliable, especially for day trading, and how to use them properly.
What Are Trading Patterns?
Chart patterns are visual formations on price charts that reflect market psychology, indicating how buyers and sellers are behaving and where momentum may be headed. In technical analysis, patterns help predict future price movements, signaling reversals, continuations, or consolidation periods.
Trading patterns work alongside price action, allowing traders to gauge market sentiment - whether bulls or bears are in control and if the trend will continue or reverse.
Recognizing these patterns early enables traders to react with clarity and precision, providing precise entries, clear targets, and a higher win rate with a positive reward-to-risk ratio. This improves consistency and helps traders grow their skills and capital over time.
Different Types of Patterns
In this section, we will break down chart patterns into three main categories: Reversal Patterns, Continuation Patterns, and Candlestick Patterns.
Reversal Patterns
Reversal patterns are powerful signals that the market might be preparing for trend reversals. They are especially useful for identifying the end of a trend and the beginning of a new one, something every day trader should watch closely.
Head and Shoulders /Inverse Head and Shoulders
The Head and Shoulders pattern signals a potential bearish reversal after an uptrend. It forms when price makes a higher high (head) but then fails to break it again (right shoulder), showing that buyers are losing momentum.
A break below the neckline confirms the shift to bearish. The Inverse Head and Shoulders is the opposite—it appears after a downtrend and signals a bullish reversal. It shows sellers losing control as price fails to make a new low and begins forming higher lows. A breakout above the neckline confirms buyer strength and trend reversal.
Double Top and Double Bottom
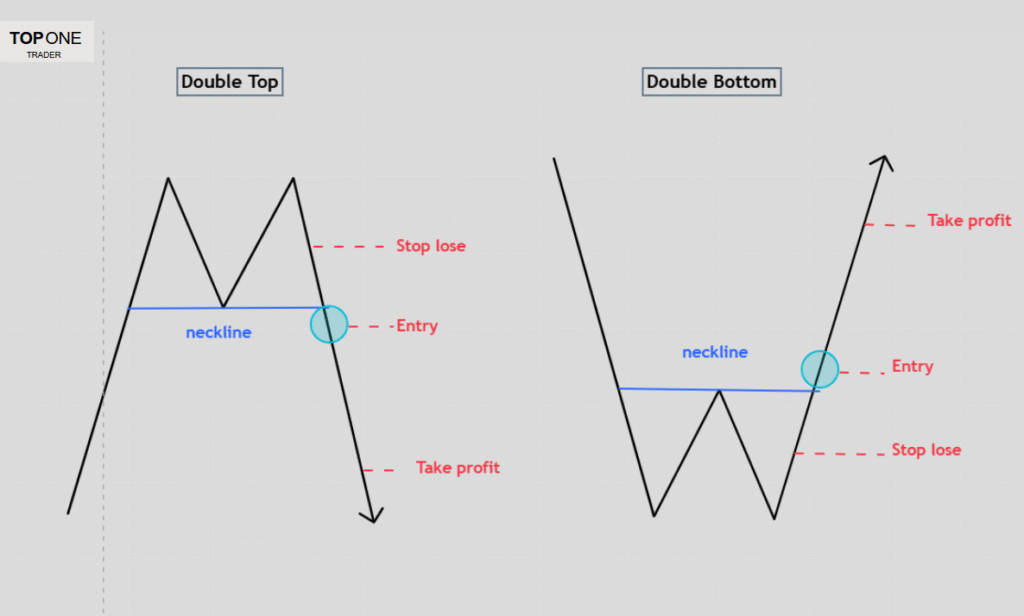
A Double Top pattern typically forms at the end of an uptrend and signals a potential bearish reversal. It occurs when the price reaches a high, pulls back, then makes another attempt to break that high, but fails. This failure to create a new high indicates that buyers are losing momentum and sellers are stepping in, preparing to push the market lower. The pattern is confirmed when the price breaks below the support level (the neckline) between the two peaks.
On the other hand, a Double Bottom forms after a downtrend and signals a potential bullish reversal. It happens when the price hits a low, bounces up, and then retests the same level without breaking it. This shows that sellers are weakening and buying pressure is returning. A break above the neckline confirms that buyers are likely to take control and drive the price higher.
Falling Wedge and Rising Wedge (reversal models)

The Falling Wedge and Rising Wedge patterns can act as both reversal and continuation patterns, depending on the trend they form in. As reversal patterns, they appear at the end of a trend. During the consolidation phase in these patterns, the price range tightens, with small candles and low volume signaling a pause in the trend.
A Falling Wedge in a downtrend suggests a bullish reversal, as weakening selling pressure is indicated by the narrowing range, and a breakout above the upper trendline confirms the reversal.
On the other hand, a Rising Wedge in an uptrend signals a potential bearish reversal, as a loss of buying momentum is shown by the narrowing range, with a break below the lower trendline confirming the downward reversal.
Continuation Patterns
When the market is trending, it doesn’t move in a straight line. There are times when price pauses, consolidates, and then continues in the same direction. That’s where continuation patterns come into play, presenting opportunities to enter the market.
Falling Wedge and Rising Wedge (continuation models)

The Falling Wedge and Rising Wedge can also serve as continuation patterns. For example, a falling wedge during an uptrend often signals that the trend will continue higher after a short pullback. Similarly, a rising wedge during a downtrend can indicate the market is preparing to drop further.
Bullish and Bearish Rectangles
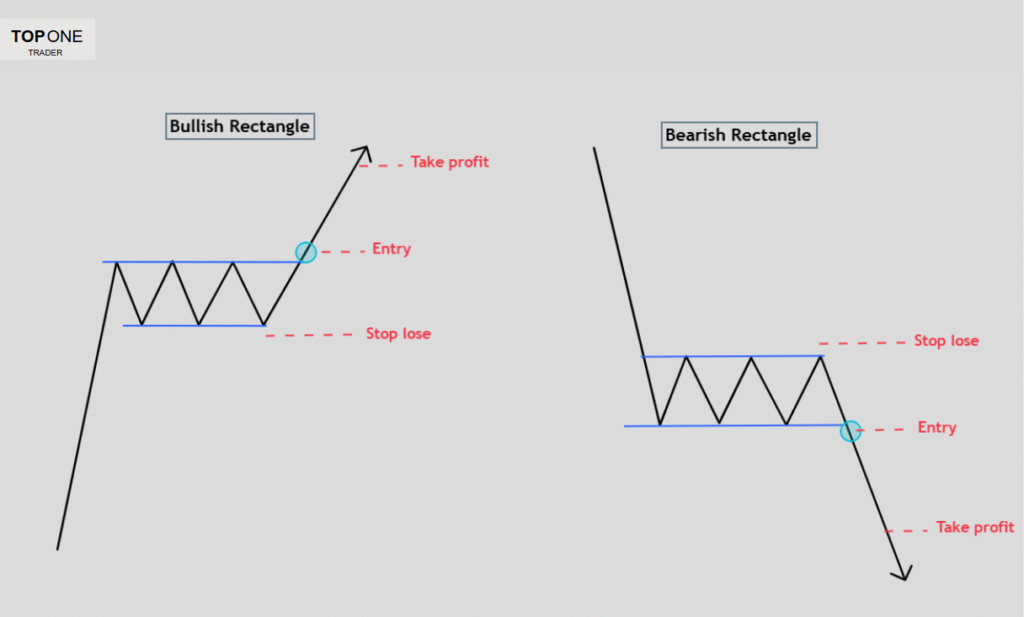
Another useful set of patterns includes Bullish and Bearish Rectangles. These show periods of consolidation - price moving sideways within a range. A bullish rectangle appears in an uptrend, and a breakout above the range confirms trend continuation. A bearish rectangle works the same way in a downtrend.
It’s worth mentioning that there are other continuation patterns, such as flags, symmetrical triangles and pennants. While their shapes differ slightly from wedges and rectangles, they function in similar ways.
These patterns indicate a pause in the market before price continues in its previous direction, making them ideal for entering mid-trend with a tighter stop-loss and a favorable reward-to-risk ratio.
Candlestick Patterns
While trading patterns provide the big picture, candlestick patterns provide a closer look at short-term price action, showing the battle between buyers and sellers through the opening and closing prices. They work best when combined with other technical analysis tools for confirmations, especially during breakouts.
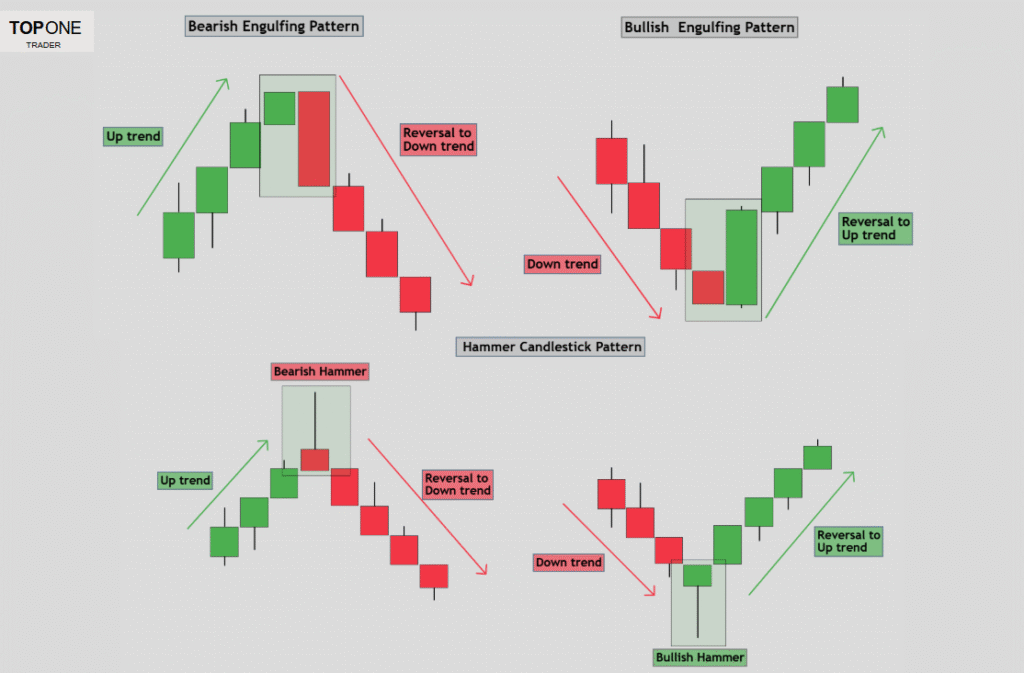
Key patterns include the Bullish and Bearish Engulfing and the Hammer. A Bullish Engulfing signals buying strength, while a Bearish Engulfing suggests a potential reversal at the top of an uptrend. The Hammer, with its long wick and small body, indicates price rejection and can signal a shift in momentum, whether bullish or bearish.
Candlestick patterns are more reliable on higher time frames (4H, daily, weekly) as they provide clearer signals. On lower time frames, however, they can produce false signals due to market noise.
To enhance the reliability of candlestick patterns, especially on lower time frames, it’s important to combine them with other tools like trendlines, key levels, and supply/demand zones. These tools can act as confirmations, strengthening trade setups and increasing the likelihood of successful trades.
How to Use Patterns Properly in Trading
Recognizing chart patterns is a strong skill, but using them effectively in real trading conditions is what truly sets successful traders apart. Trading patterns alone don’t guarantee profits, they need to be used with proper context, confirmation, and discipline.
Patterns Are Only Part of the Puzzle
Chart patterns reflect market psychology, but they shouldn’t be used in isolation. Always combine them with confirmation tools like candlestick patterns, volume, or indicators. This helps filter out low-probability setups and boosts accuracy.
Time Frames and Trend Context
Always use multiple time frames when conducting market analysis, especially in day trading.
A setup on the 15-minute chart may look promising, but if it goes against the prevailing trend on the 4-hour or daily chart, it’s more likely to fail. Trends are a core element of market structure and help traders understand where the market is heading.
The higher the time frame, the more respected the trend, trading patterns, and key levels tend to be. The best way to identify trends is through trend lines and market structure, which provide visual clarity and directional bias. Use higher time frames to define the overall trend and key zones, and lower time frames to pinpoint precise entries and confirmations.
By applying multiple time frame analyses, you can anticipate market movements with greater confidence. Patterns like bullish flags or double bottoms are most effective when they align with the dominant trend direction, reinforcing the reliability of your market analysis.
Use Volume and Candlestick Confirmation
Volume confirms the strength behind a price move. A breakout accompanied by strong volume is more likely to succeed than one with weak volume. Candlestick patterns—such as bullish engulfing or hammer formations—can also serve as strong confirmation signals, especially when they appear at key levels like support, resistance, demand zones, or during breakouts.
Key Levels add conviction
Chart patterns are more significant when they form near key levels, such as previous support or resistance, supply and demand zones, psychological levels, or Fibonacci retracement levels.
For example, a double top forming just below a major resistance zone that has been tested multiple times is far more likely to play out than one that appears in the middle of a random price area.
Stacking confluences like key levels and other technical tools helps increase the reliability and probability of your trades.
Indicators and Fundamental Analysis
Technical indicators like RSI and MACD can strengthen your pattern-based setups. For example, RSI divergence during a pattern, like a falling wedge, can signal a potential opportunity with strong momentum.
Always consider fundamentals too. News events drive price and can explain market dynamics, often overriding technical setups. A pattern may look perfect, but high-impact news like interest rate decisions or inflation data can cause sharp, unexpected moves. Always check the economic calendar and avoid trading blindly around major events.

Stay ahead of the market with Top One Trader’s Economic Calendar. Track key economic events and news releases to make informed trading decisions. Stay prepared and trade with confidence today!
Entry, Exit, and Risk Management
Spotting a pattern is just the first step; execution is key. Look for breakout points with confirmation, such as a strong candle close and rising volume. Set profit targets based on pattern size, like measuring the distance in a double bottom and projecting it upward.
Use the OTE (Optimal Trade Entry) strategy, waiting for a pullback to a Fibonacci retracement zone (61.8%-79%) for more precise entries and tighter stop-losses. Always use a stop-loss to protect your account, especially if you are trading using a prop firm account, they have strict drawdown rules.
Keep risk small per trade, ideally 0.25%-0.5%, to avoid exceeding drawdown limits. Aim for a reward-to-risk ratio of at least 2:1, but higher ratios may be possible with tested setups.
Backtest and Build a Strong Mindset
Before trading live, backtest your strategy thoroughly. This helps you understand your win rate, average risk-to-reward ratio, and potential drawdowns. It also reveals which markets and time frames your strategy performs best on. With solid backtesting data, you’ll have more confidence in your edge and be better prepared to execute your plan with discipline.
But even the best strategy won’t save you if your mindset isn’t right. Fear, greed, and impatience can ruin great setups. Building strong trading habits—like discipline, patience, and emotional control—is just as important as mastering technical skills.
Here are some quick mindset tips:
Don’t chase trades. Let the setups come to you.Accept losses. They’re part of the game; Focus on long-term consistency.Focus on the process, not the outcome. Stick to your plan, win or lose.Journal every trade. Review both your wins and losses to improve continuously.

Conclusion:
Trust the Patterns, Respect the Process
Understanding market behavior through identifying chart patterns gives traders a clearer view of price action. While recognizing trading patterns - especially trend continuation patterns - can help you anticipate market movements, success doesn't come from patterns alone.
It’s about how you incorporate them into your trading plan with patience, discipline, and strong risk management. Use confirmation tools, and technical indicators stay aligned with the bigger picture, and maintain control of your mindset.
Trading is a continuous journey. With the right tools, mental resilience, and proper risk management, you can make these patterns work for you and ultimately succeed in the financial markets.
Take your trading to the next level with Top One Trader. The platform supports various strategies and provides educational resources to help you build and refine your own strategy. Start trading today and gain access to the tools and support needed for success!
-1%201%20(1).webp)