Falling Wedge Pattern: Spotting Breakout Opportunities in Any Market


In trading, emotions are often a trader's worst enemy. The most successful traders rely on disciplined strategies rather than gut feelings. A clear strategy is invaluable, as it helps identify high-probability setups with defined entry and exit points.
There are many trading strategies, and today we’ll focus on patterns—specifically, the falling wedge pattern, a powerful model that predicts price movement and signals either a reversal or continuation.
The falling wedge forms when an asset's price moves between two converging downward-sloping trendlines. The upper trendline connects a series of lower highs, while the lower trendline connects a series of lower lows at a slower decline. This pattern is particularly valuable because it often marks a turning point where selling pressure weakens, creating opportunities for substantial upside moves.
Understanding the Two Types of Falling Wedges
The falling wedge can appear in two distinct market contexts, each with its own implications:
1. The Continuation Pattern
When a Falling wedge occurs during an established uptrend, the price consolidates temporarily before the upward movement resumes. This phase acts as a breather for the market, with the price contracting within two lower trend lines.
During this consolidation, trading volume gradually decreases, signaling that sellers are losing momentum and failing to push prices significantly lower. The price action forms lower highs, but the lows decline at a slower rate, creating a narrowing wedge shape. This indicates that while sellers are present, their strength is fading compared to that of buyers.
Once consolidation is complete, the price eventually breaks out above the upper trendline, confirming the continuation of the uptrend. This breakout is typically accompanied by an increase in volume, reinforcing the idea that buyers are regaining control and pushing the price higher.
2. The Reversal Pattern
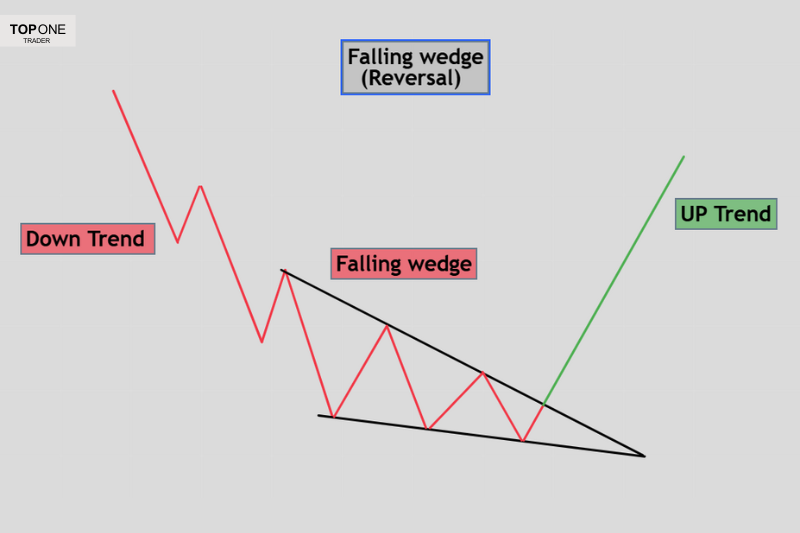
When a falling wedge appears in a downward trend, it often signals a trend reversal. While the price continues forming lower highs, the lows drop more gradually along the lower trendlines, indicating weakening selling pressure as buyers start stepping in.
As the wedge forms, trading volume decreases, indicating market indecision. Sellers struggle to push prices lower, while buyers gradually gain strength. Once the price breaks above the upper trendline with increased volume, it confirms the breakout, signaling a potential trend reversal. Traders can enter a long position upon confirmation and capitalize on the move.
How to Trade the Falling Wedge Effectively
For Continuation Setups:
The entry strategy should be patient and disciplined when a falling wedge pattern occurs. Wait for the price to close above the upper trendline, rather than just touching it. Many false breakouts occur when prices briefly spike above resistance only to fall back. The ideal confirmation occurs when this breakout is accompanied by a significant increase in volume, signaling strong buying pressure.
This breakout serves as a confirmation signal for traders, presenting a high-probability opportunity to enter a long position. The best trade setup involves waiting for the breakout, confirming it with volume, and placing an entry point at or just above the broken trendline. To manage risk, a stop-loss should be placed below the most recent swing low.
Examples
Having a clear strategy is essential, but you need capital to turn that strategy into profits. Top One Trader provides you with the capital and equips you with the essential tools to trade successfully. Sign up today to get your funded account.
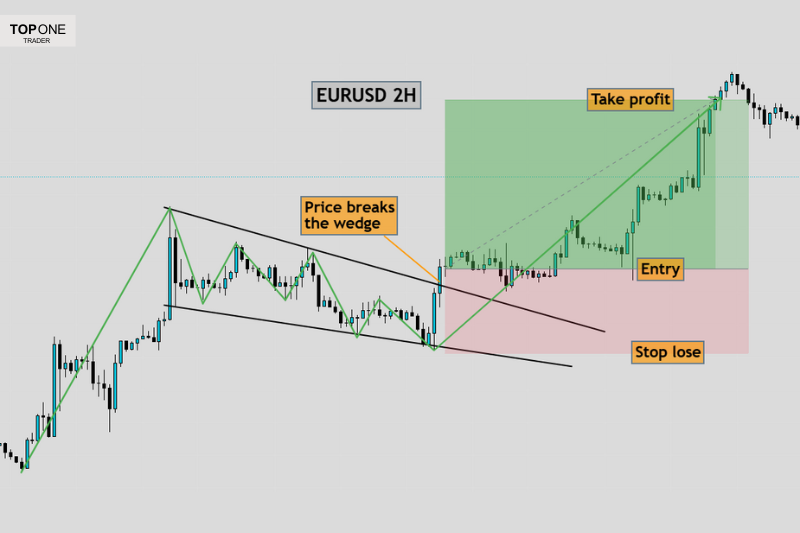
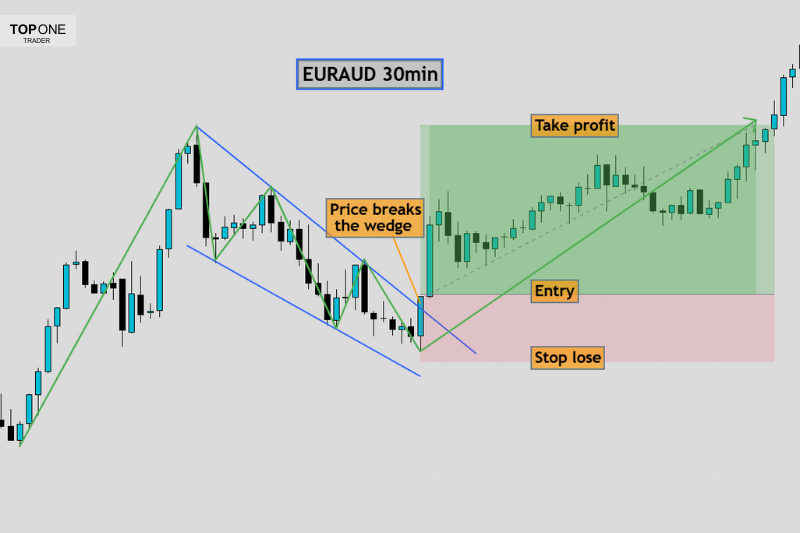
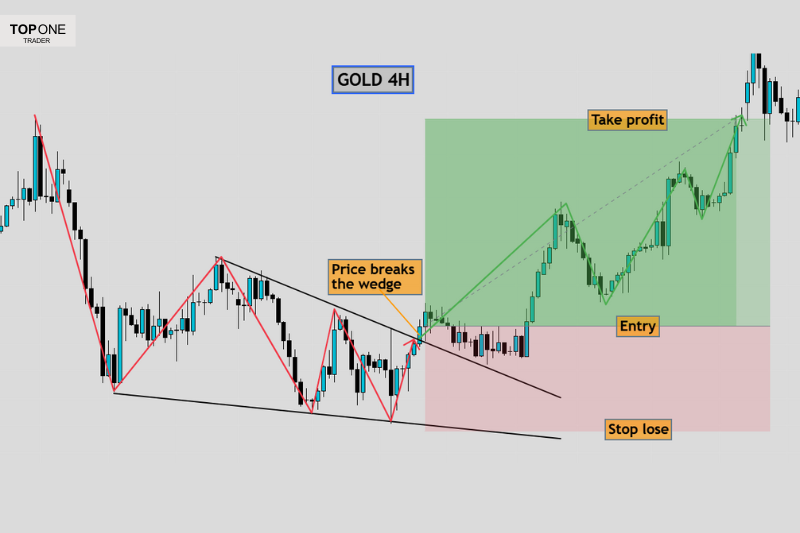
For Reversal Setups:
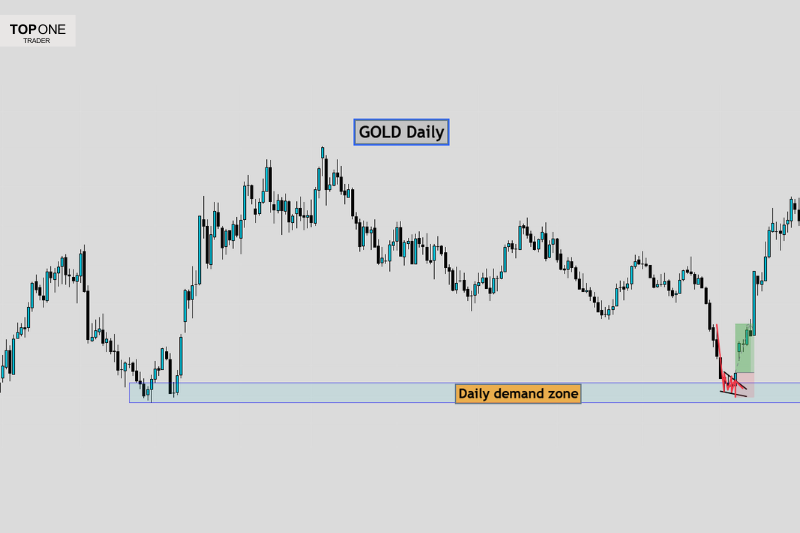
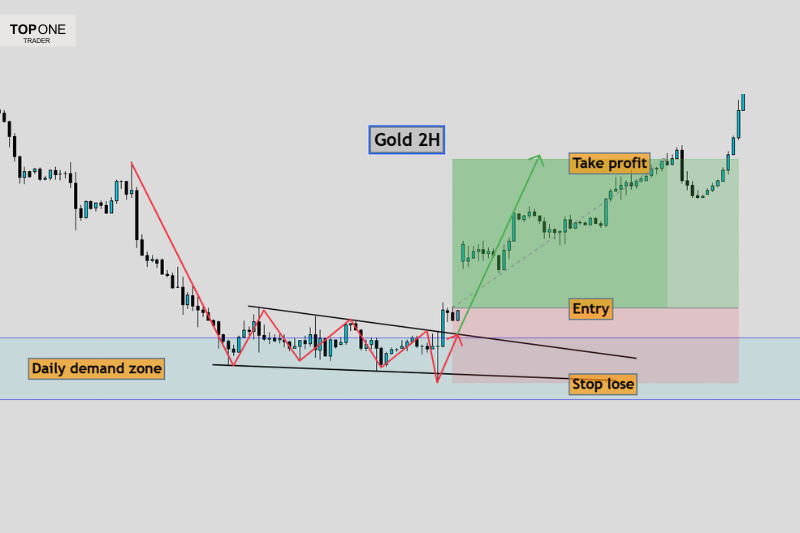
The principles are similar but require extra caution. Since you're attempting to catch a major trend change, it's wise to wait for confirmation on higher time frames. Key areas on the 4-hour or daily charts carry more weight than those on shorter time frames. These key areas help identify potential reversals, which should be aligned with the falling wedge pattern for a stronger setup.
Stop-loss placement is particularly crucial for reversal trades. Conservative traders may place their stop-loss below the entire wedge formation for added security, while more aggressive traders could set it at the most recent swing low to allow for a tighter risk-reward ratio. The key confirmation of the reversal occurs when the price breaks above the upper trendline of the wedge, typically accompanied by a sharp increase in volume. This breakout signals that buyers have taken control and that a bullish trend shift is underway.
Examples
Essential Risk Management
Regardless of which variation you're trading, strict risk management is non-negotiable. Always maintain at least a 1:2 or 1:3 risk-reward ratio, meaning your potential profit should be at least twice your potential loss. This approach ensures that even if only half of your trades are successful, you’ll still break even or remain profitable over time.
Position sizing should be calculated based on the pips you're willing to risk in your stop-loss and your overall capital. For risk per trade, it’s recommended to risk between 0.25% and 0.5% per trade to protect your account, especially for prop firm accounts that have strict drawdown limits. Proper risk management helps sustain long-term consistency and prevents significant losses.
Use Top One Trader’s position size calculator to determine the ideal risk level for each trade. Take control of your risk management and trade smarter today!
Confirming Your Falling Wedge Trades: Essential Filters
While the falling wedge pattern itself provides a solid foundation, incorporating confirmation tools can significantly boost your success rate. These filters help separate high-probability setups from potential false signals.
Volume and candlestick
Pay close attention to the candlestick during the falling wedge breakout. A large bullish candlestick closing near its high suggests strong buying momentum and conviction. Specifically, a bullish engulfing candle during the breakout, combined with high volume, indicates that buyers are fully in control. This is a clear confirmation to enter a long position, as it signals the beginning of a potential bullish rally.
Trend Context Matters
For continuation setups, the strength of the preceding uptrend is crucial. The market should display a clear pattern of higher highs and higher lows, indicating strong bullish momentum before the wedge forms. If the prior trend is weak or choppy, the falling wedge pattern becomes less reliable, as the market may lack the necessary buying pressure to sustain a continuation.
A well-defined bullish trend increases the probability that the falling wedge is merely a temporary consolidation, rather than a deeper reversal. When the breakout occurs with strong volume, it confirms that buyers are reclaiming control, making the setup more valid for a long entry.
Key Levels Add Conviction
Key levels are essential when trading both continuation and reversal falling wedge patterns.
For continuation setups, if the wedge forms near a supply zone or a resistance level, the pattern may struggle to succeed. These areas attract sellers who can overpower buyers
attempting to break out, especially on higher time frames. In such cases, it's best to avoid the trade and look for opportunities with less resistance.
For reversal setups, if the falling wedge occurs just above a strong support level that has held multiple times, it increases the chance of the wedge working well. This suggests buyers are stepping in, making a bullish move more likely. Always identify key support and resistance levels before trading the wedge to improve accuracy.
RSI divergence
When a falling wedge occurs, the price consolidates temporarily before resuming its upward movement. During this consolidation, RSI divergence can provide a powerful confirmation.
Even though the price forms lower lows within the wedge, the RSI forms higher lows, indicating that selling pressure is weakening while buyers are gradually gaining strength.
This divergence suggests that the downtrend is merely a correction rather than a reversal, and that buyers are ready to push the price higher once the consolidation phase is over. This divergence is especially significant when it appears on higher time frames, enhancing the reliability of the pattern.
Fibonacci for Precision Trading
Incorporating Fibonacci levels can refine both entries and targets. For entries, the Optimal Trade Entry (OTE) zone between the 0.618-0.786 retracement of the wedge's height often provides low-risk opportunities after the initial breakout. For reversal targets, the 0.618 retracement of the prior downtrend is a key objective, while the 1.00 level offers a higher reward potential. Targeting these levels can maximize the reward-to-risk ratio.
Conclusion
A well-executed trading strategy relies on discipline, patience, a deep understanding of technical analysis, risk management, and a clear mindset.
The falling wedge chart pattern, whether signaling a reversal or continuation pattern, provides traders with a valuable framework for identifying high-probability setups. By combining this pattern with volume analysis, key levels, RSI divergence, and Fibonacci retracements, traders can enhance their decision-making and improve their risk-to-reward ratio.
However, no strategy can win every time. Proper risk management, including controlled position sizing and strict stop-loss placement, is essential to long-term success. The best traders don’t just chase signals—they refine their approach, wait for confirmation, and manage their risk effectively. By doing so, they turn patterns like the falling wedge into powerful tools for capturing market opportunities while protecting their capital.
Take your forex trading to the next level with Top One Trader. The platform supports various strategies and provides educational resources to help you build and refine your own strategy. Start trading today and gain access to the tools and support needed for success!
-1%201%20(1).webp)