
Top Forex Trading Patterns To Pass Prop Firm Challenges

Prop firm challenges have become one of the most popular opportunities for traders looking to access significant capital.
However, passing these challenges isn’t just about luck—it requires a deep understanding of technical analysis, risk management, and a disciplined mindset. Many traders struggle with consistency because they fail to recognize high-probability setups and make good trades. This is where chart patterns play a crucial role in predicting price movements.
Mastering chart patterns provides traders with a structured approach to evaluating trends, identifying entry points, and spotting high-quality setups. When combined with a strict risk management plan and the right mindset, they give traders an edge, allowing them to make informed decisions rather than relying on guesswork.
In this guide, we will break down the most important forex trading patterns that can help you identify high-probability setups and become a funded trader. By the end, you’ll have a clear understanding of how to use these patterns effectively to maximize profits while minimizing risk.
Understanding Forex Trading Patterns
Forex trading patterns are visual representations of price movement that indicate potential market direction. These formations develop over time and provide traders with insights into whether the market will likely reverse, continue trending, or consolidate before a breakout.
Patterns play an important role in technical analysis by helping traders anticipate movements rather than react to them. Recognizing these formations on charts allows traders to set precise entry and exit points, reducing the risk of poor trade execution.
Key Aspects of Trading Patterns
- Trend Identification – Align patterns with the market trend (uptrend, downtrend, or reversal).
- Structure & Formation – Recognize pattern shapes early for better trade setups.
- Price Action – Analyze candlestick behavior, wicks, type and size of the candle, and momentum to confirm patterns.
- Volume Confirmation – Strong price movement needs high volume; weak volume may signal false moves.
- Support & Resistance – Patterns often form around key levels, helping determine entries/exits.
- Breakout & Retest – A retest after a breakout strengthens confirmation and reduces false signals.
- Timeframe Consideration – Higher time frames provide stronger signals, while lower ones offer frequent setups.
- Risk Management – Use stop-loss, take-profit, and proper risk-reward ratios for consistency.
Reversal Chart Patterns
Reversal patterns signal a potential change in the current trend, whether it’s a shift from an uptrend to a downtrend or vice versa. These formations indicate that market sentiment is shifting, and traders should prepare for a potential trend reversal.
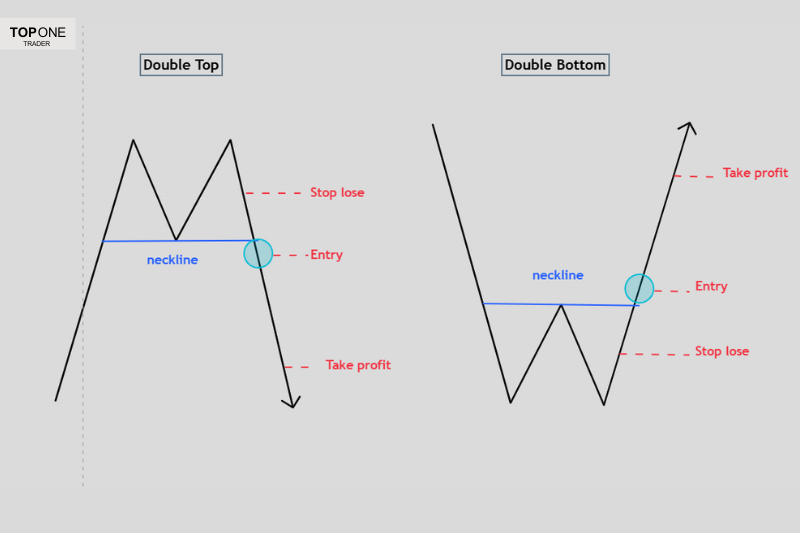
Double Top & Double Bottom
- Double Top: A bearish reversal pattern that forms after an uptrend. The price reaches a resistance level twice before reversing downward, signaling that buyers are losing control.
- Double Bottom: A bullish reversal pattern that occurs after a downtrend. Price tests a key support level twice before bouncing higher, indicating strong buying pressure.
Head and Shoulders & Inverse Head and Shoulders
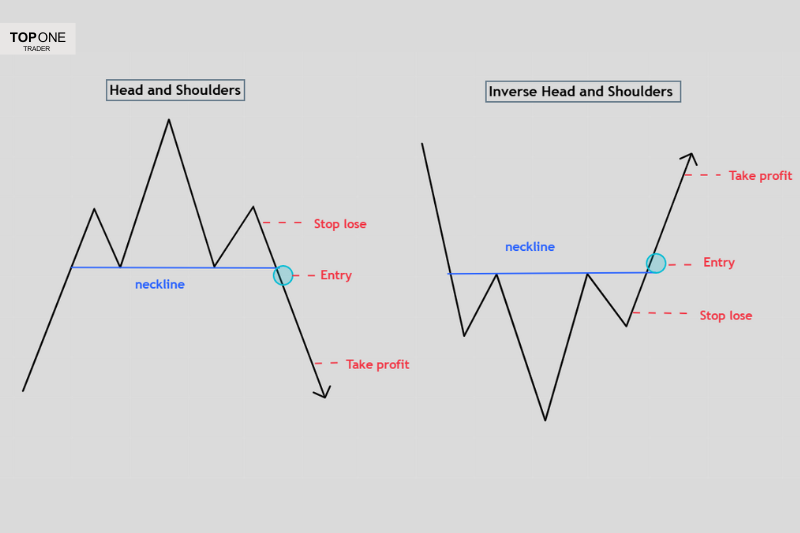
- Head and Shoulders: A bearish reversal pattern that forms after an uptrend. It consists of three peaks, with the middle peak (head) being the highest. A break below the neckline confirms the downtrend.
- Inverse Head and Shoulders: A bullish reversal pattern that forms after a downtrend. It mirrors the standard head and shoulders but signals a shift to an uptrend upon breaking the neckline.
Becoming a funded trader is an exciting opportunity, but having the right skills is essential! Top One Trader provides you with the necessary tools and real capital in a supportive environment, giving you the chance to take advantage of opportunities without risking your own funds.
Rising Wedge & Falling Wedge chart patterns
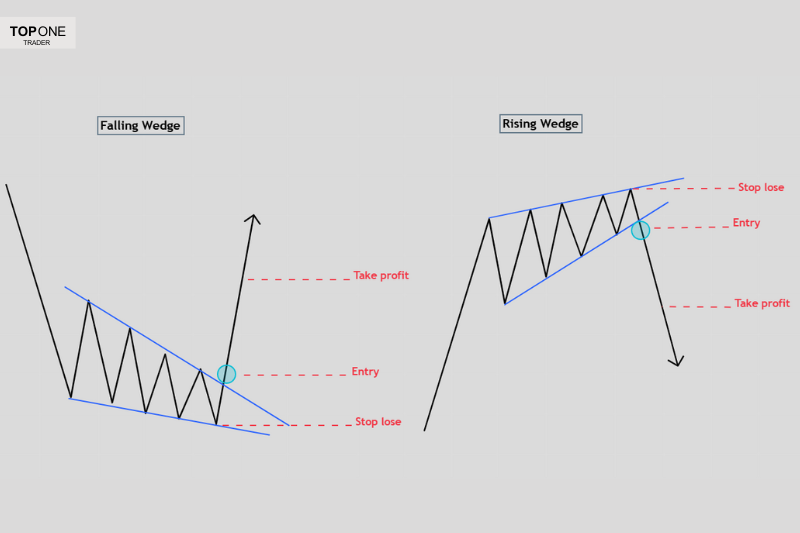
- Rising Wedge: A bearish pattern that forms when price consolidates within upward-sloping support and resistance lines. The support line is steeper than the resistance, indicating a loss of bullish momentum. When price breaks below the wedge, a downtrend usually follows.
- Falling Wedge: A bullish pattern where price consolidates downward but in a way that suggests a reversal is coming. The resistance line is steeper than the support line, and a breakout to the upside signals the beginning of a bullish trend.
Continuation Chart Patterns
Continuation patterns indicate that the current trend is likely to persist after a brief consolidation phase. These formations provide traders with opportunities to enter trades in the direction of the prevailing trend with confidence.
Falling Wedge & Rising Wedge chart patterns
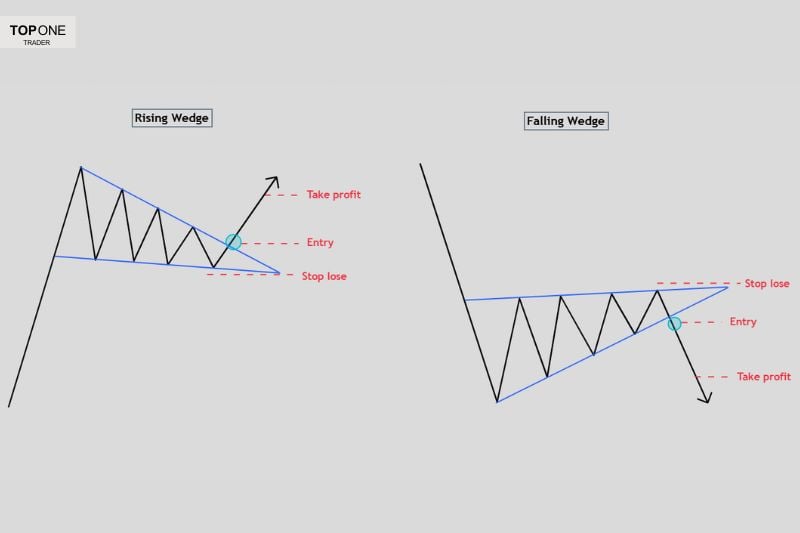
While wedges can act as reversal patterns, they can also serve as continuation signals.
- Falling Wedge as a Continuation: When this pattern appears in an uptrend, it often signals that the price is merely pausing before continuing higher.
- Rising Wedge as a Continuation: In a downtrend, a rising wedge indicates that the market is consolidating before continuing its move downward.
Bullish & Bearish Rectangles

- Bullish Rectangle: A consolidation phase where price moves sideways within a range before breaking higher. Traders look for a breakout above resistance to confirm bullish momentum.
- Bearish Rectangle: Similar to the bullish rectangle but in a downtrend. Price consolidates within a range before breaking lower, confirming further bearish movement.
Bullish & Bearish Pennants
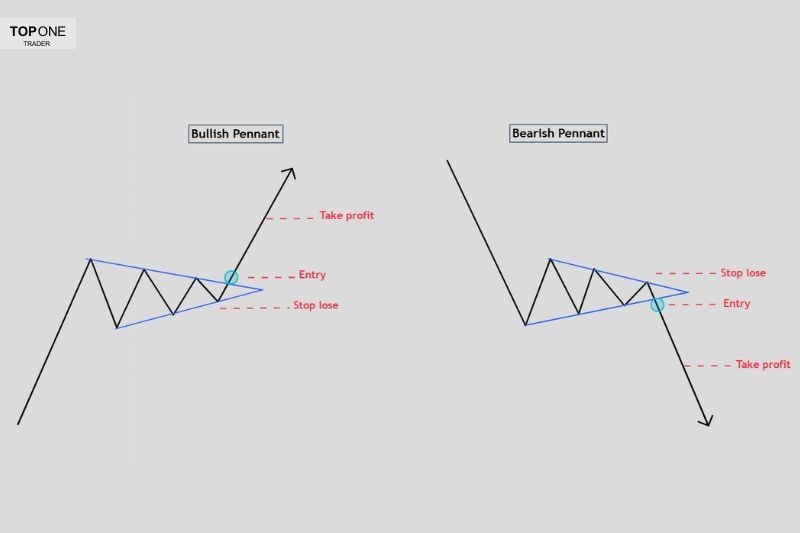
- Bullish Pennant: Forms after a strong uptrend where price consolidates in a small triangular formation before breaking out higher.
- Bearish Pennant: Appears after a strong downtrend, with price forming a small consolidation phase before breaking lower.
By understanding and effectively using reversal and continuation patterns, traders can develop a structured approach to passing prop firm challenges. The next section will cover bilateral patterns and the role of supply and demand zones in market movements. Mastering these concepts will further refine your trading strategy and increase the likelihood of passing prop firm evaluations successfully
Bilateral Chart Patterns (Breakout in Either Direction)
Bilateral chart patterns indicate that the market is consolidating and could break out in either direction. These formations are crucial in forex trading, as they highlight indecision before a strong price movement. Traders must be ready to react when the breakout occurs, using price action confirmation.
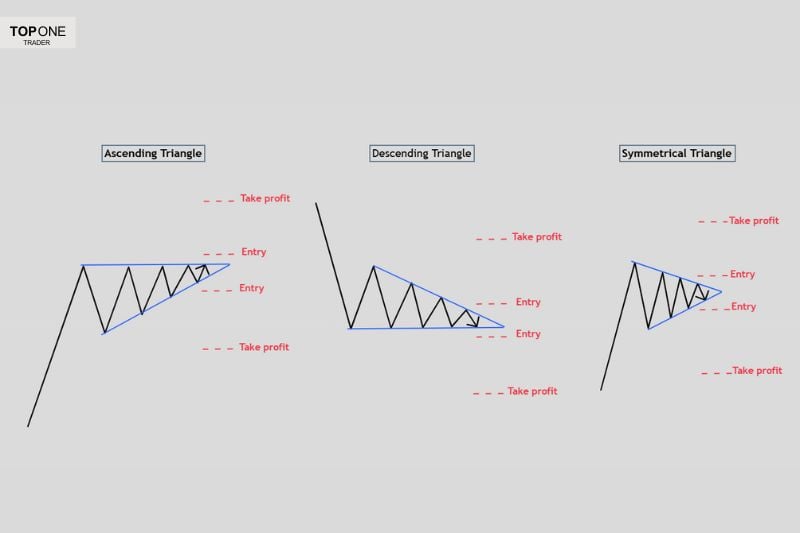
Ascending Triangle
The ascending triangle is a bullish pattern formed when the price makes higher lows while resistance remains at a fixed level. This suggests growing buying pressure, and a breakout to the upside is often expected. However, in some cases, the price may break downward, making it essential to confirm the breakout direction before entering a trade.
Descending Triangle
In contrast, the descending triangle is a bearish pattern where the price forms lower highs while support stays fixed. This indicates increasing selling pressure. A breakdown below the support level typically signals further downside movement, but if buyers regain control, an upward breakout could occur.
Symmetrical Triangle
The symmetrical triangle is a neutral pattern that forms when both the support and resistance lines slope toward each other, creating a ranging price movement. This pattern reflects market indecision, meaning the breakout could happen in either direction. Traders watch for volume and momentum to confirm which side the price will break toward.
Supply and Demand
Supply and demand zones are fundamental in forex trading, helping traders identify areas where price is likely to make significant movements. Unlike wedge patterns, supply and demand zones require a deeper retracement into areas where buying or selling pressure is concentrated, making them crucial for determining entry and exit points.
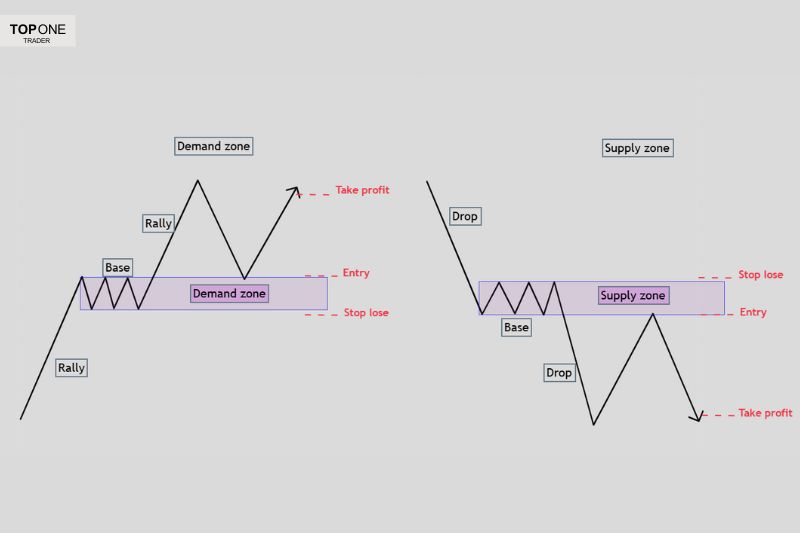
Demand Zones – Identifying Strong Buying Areas
A demand zone is an area where the price has historically bounced upward due to strong buying interest. These zones are formed when institutional traders place significant buy orders, causing the price to rally. When price returns to a demand zone, traders look for confirmation signals, such as bullish candlestick formations or trend line support, before entering long positions.
Supply Zones – Recognizing Where Sellers Take Control
A supply zone is the opposite of a demand zone, representing areas where selling pressure has historically driven the price downward. These zones are formed when institutional traders place large sell orders. When price retests a supply zone, traders look for bearish confirmation, such as a false break above resistance or bearish candlestick patterns, to take short positions.
Key Focus: Price Action Validation
To avoid unnecessary losses, traders must validate supply and demand zones using price action signals. Factors such as volume spikes, candlestick confirmations, and Multi-Time frame analysis help increase the accuracy of trades taken from these levels.
How to Use These Patterns to Pass a Prop Firm Challenge
Passing a prop firm challenge requires a combination of trading strategy, risk management plan and emotional control. Here’s how traders can apply these chart patterns effectively:
1. Choosing the Right Timeframe for Trading
Understanding the importance of multiple time frame analysis is essential for making informed trading decisions. Higher time frames, such as daily charts and 4-Hour, provide a broader view of the market trend. These time frames are better for identifying key patterns and trend direction because they reduce noise and false signals. Patterns that form on higher time frames are typically more reliable, resulting in higher-quality setups and a higher win rate.
On the other hand, lower time frames (such as 1-Hour or 15-Minute) help refine entry points with more precision. When a pattern is observed on a higher time frame, it holds more weight and is considered a stronger signal, increasing the likelihood of successful trades.
By combining both higher and lower time frames, traders can enhance their analysis and improve their chances of executing profitable trades.
2. Using Trend Lines & Key Levels to Confirm Pattern Validity
A rising wedge, for example, should show clear resistance and support slopes converging. Similarly, key levels such as support and resistance zones, psychological price points, and Fibonacci retracement levels help validate whether a pattern is forming correctly.
3. Avoiding False Breaks
False breaks occur when the price temporarily moves beyond a pattern’s boundary but then reverses direction. To avoid falling into traps, traders must wait for confirmation signals like a strong close beyond a breakout level, volume confirmation, or retests of the broken level before entering a trade.
4. Using Risk Management to Avoid Unnecessary Drawdowns
Risk management is key in any trading strategy, but it’s especially critical in prop firm challenges where strict drawdown limits apply. Here are essential risk management techniques:
- Proper Position Sizing: Never risk more than 0.25-0.5% of the prop firm account balance per trade.
- Use Stop Losses: Set stop losses based on price volatility and important levels, not random points.
- Take Profits at Key Levels: Partial take profits at major support/resistance help secure gains while letting the trade run.
- Maintain a Good Risk-Reward Ratio: A minimum of 1:2 or 1:3 ensures that wins outweigh losses over time.

Conclusion
Mastering forex trading patterns is essential for passing a prop firm challenge successfully. Reversal patterns like the double top and head and shoulders indicate potential trend shifts, while continuation patterns such as wedges and pennants help traders ride existing trends.
Bilateral patterns like triangles signal potential breakouts in either direction, requiring traders to be prepared for both scenarios. Additionally, understanding supply and demand zones provides an extra layer of confluence when analyzing market movements.
By combining price action analysis, key levels, and proper risk management, traders can significantly improve their accuracy and success rate in prop firm challenges.
However, passing a challenge isn't just about recognizing patterns—it’s about executing trades with discipline and confidence. Backtesting these patterns and refining strategies before taking the evaluation can make all the difference in achieving consistent profitability.Take your forex trading to the next level with Top One Trader. The platform supports various strategies and provides educational resources to help you build and refine your own strategy. Start trading today and gain access to the tools and support needed for success!
-1%201%20(1).webp)


