Inverse Fair Value Gap Explained

Why do so many traders, even those with access to large capital in prop firms, struggle to maintain profitability? The answer often lies in the absence of a clear strategy, a strict risk management plan, and an undisciplined mindset. Prop firms offer significant funding opportunities, but without a plan, traders risk blowing their accounts.
There are so many trading strategies, each with its strengths and weaknesses. In recent years, one concept has gained significant popularity—the Fair Value Gap (FVG) and its refined version, the Inversion Fair Value Gap (IFVG).
But the question remains: Can IFVGs be used as a reliable trading strategy? This is what we’re going to find out in this article.
Understanding Fair Value Gaps (FVGs)
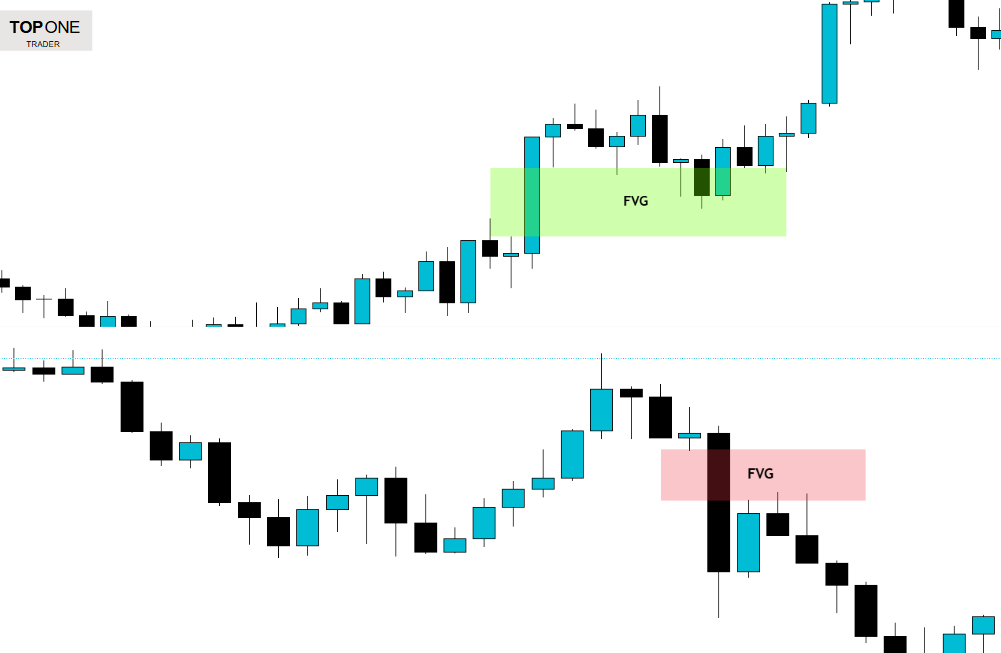
Fair Value Gaps (FVGs) are market inefficiencies that occur when there is a strong price movement, leaving a gap between consecutive candles. These gaps represent an imbalance between buyers and sellers, often serving as key areas where price may revisit before continuing in the initial direction. Traders use FVGs to identify points of interest in the market.
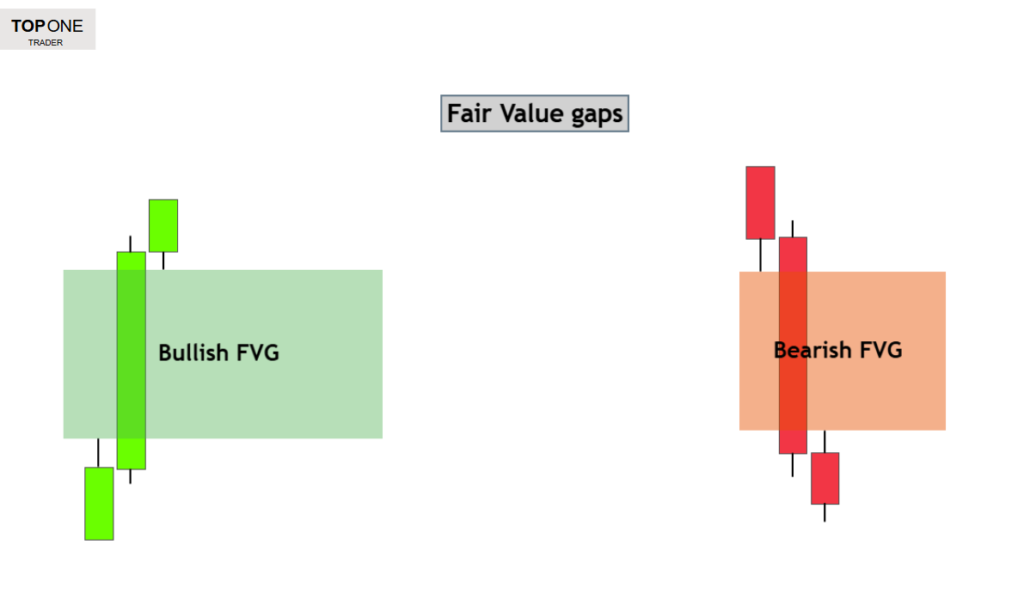
FVGs can be classified as:
- Bullish fair value gap – Formed when an aggressive bullish move leaves a gap, indicating strong buying pressure. The price often retraces to this zone before resuming the upward trend.
- Bearish fair value gap – Created during a sharp bearish move, signifying strong selling pressure. The price tends to revisit this area before continuing lower.
These gaps act as magnets for liquidity, making them valuable tools for traders looking for precise entries and exits.
Examples of bullish and bearish FVGs
Explanation of Inversion Fair Value Gaps (IFVGs)
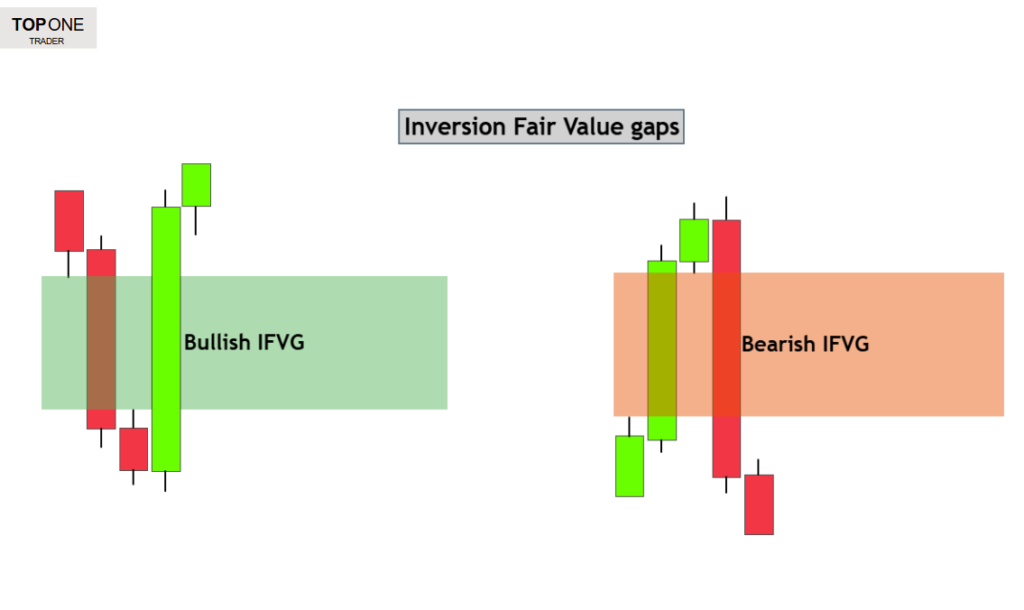
Inversion Fair Value Gaps (IFVGs) take the concept of FVGs a step further by introducing a dynamic shift in how price interacts with these gaps. Unlike traditional FVGs, which are expected to get filled and lead to continuation in the original direction, IFVGs occur when the price invalidates an existing FVG but then respects it in the opposite direction.
This shift happens when market conditions change and liquidity rebalances, causing a previous FVG to act as a new point of interest, but in reverse. Traders utilize IFVGs to identify trend shifts and potential reversals with high precision.
There are two types of IFVGs:
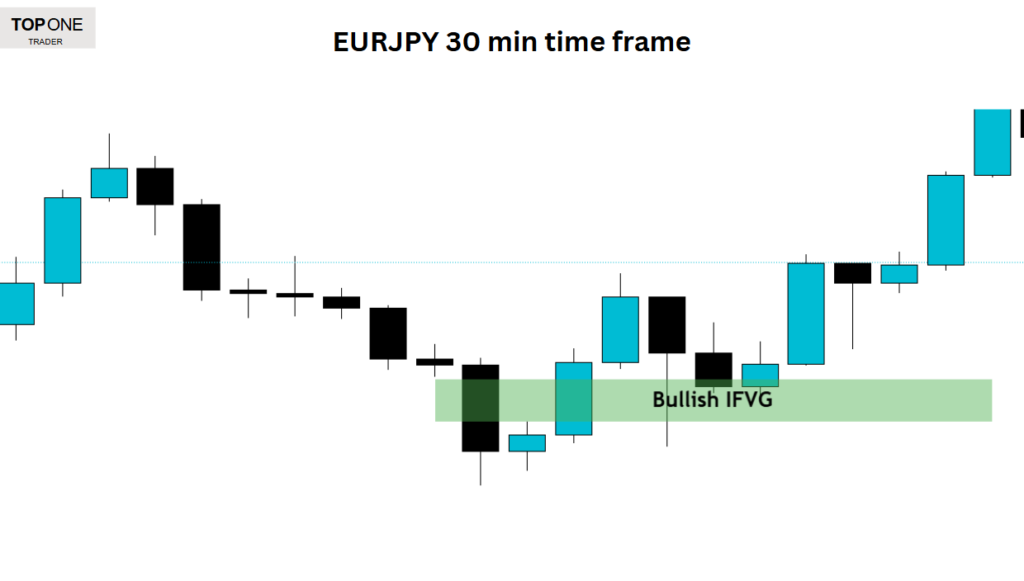
- Bullish IFVG – A previously bearish FVG that gets invalidated and turns into a bullish opportunity, indicating a shift in market structure and potential upside momentum.
- Bearish IFVG – A previously bullish FVG that flips into a bearish signal, showing strong downside pressure and a likely trend reversal.
Having a clear strategy is essential, but you need capital to turn that strategy into profits. Top One Trader provides you with the capital and equips you with the essential tools to trade successfully. Sign up today to get your funded account.
Example of a bullish IFVG
Building a Strategy Around Inversion Fair Value Gaps (IFVGs)
Mastering the identification and use of IFVGs allows traders to refine their strategies, enhancing their ability to spot high-probability trade setups while managing risk effectively. By combining IFVGs with market structure and liquidity analysis, traders can improve their chances of maintaining consistency in prop firm challenges and beyond.
Trend Analysis
Developing a robust trading strategy that centers on inversion fair value gaps (IFVGs) starts with aligning your trades with the prevailing market trend. Whether observing a bullish momentum or a bearish run, it’s essential to use IFVGs within the context of the existing directional bias. By combining these gap signals with market structure and confirmations from higher time frames, you create a more reliable gap trading strategy.
Liquidity analysis
Consider the role of buy-side and sell-side liquidity in your trading decisions. Key liquidity zones, such as previous highs and lows, often mark areas where fair value gaps (FVGs) tend to form. When you observe a liquidity sweep, whether it results in a bearish or bullish fair value gap, it signals that the market is actively rebalancing.
By focusing on these zones, you can identify where an Inversion Fair Value Gap (IFVG) might form after a failed FVG, offering a potential reversal signal.
Confirmation entries
Confirmation entries are a vital part of this strategy. Instead of rushing in as soon as an IFVG appears, wait for a clear Change of Character (CHOCH) to validate the signal, which provides clear evidence of a price reversal.
Once this shift is confirmed, placing a limit order at the borders of the IFVG can offer an optimal entry point. This method provides a high-probability setup and ensures that you’re not trading based on false signals or a failed Inversion Fair Value Gap.
Risk management
Risk management is equally critical, especially in prop firm environments where drawdown limits are strict. Always set your stop loss just beyond the invalidated gap or the most recent swing high/low to protect your capital.
A solid approach is to take profit at key levels; consider taking portions of your profit as the price closes at significant zones, whether in a bullish or a bearish move. Keeping risk per trade between 0.25% and 0.50% is advisable.
Diversify your trades across different markets, such as forex, commodities, and stocks, to avoid overexposure. This diversification, combined with careful position sizing and risk management, enables you to maintain consistency even when faced with occasional false signals or volatility shifts.
Backtesting
Finally, backtesting your strategy across various markets and time frames is important. Backtesting helps refine your approach. By analyzing historical data, you can determine which market conditions favor the formation of bullish IFVGs versus bearish IFVGs and adjust your trading decisions accordingly. This rigorous process not only solidifies your strategy but also builds the confidence needed to execute trades in real time.
How to Trade IFVGs – Real Examples
Example 1
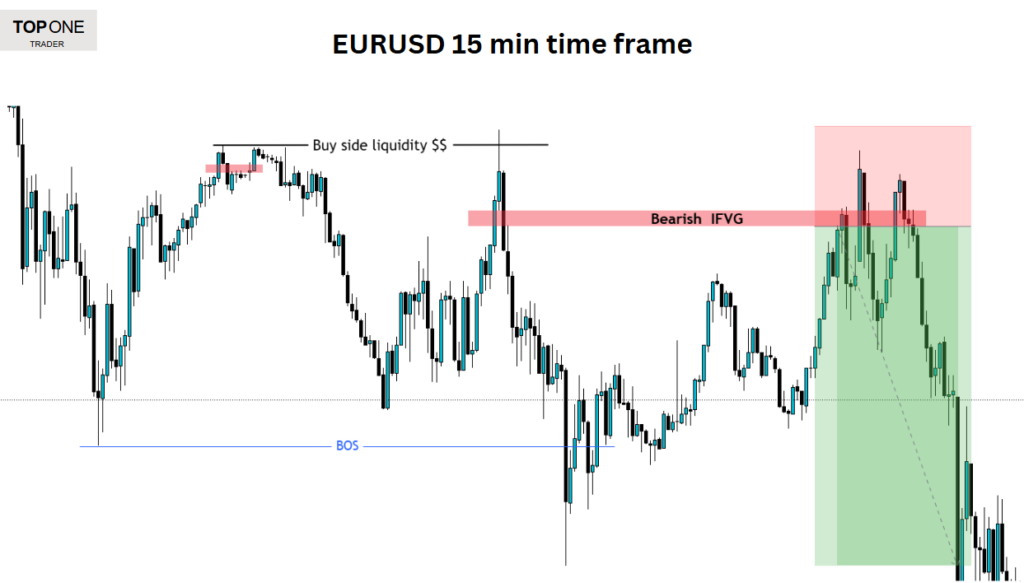
In this chart, price initially took out buy-side liquidity before forming a bearish Inverse Fair Value Gap (IFVG). Instead of filling the imbalance fully, the price reversed sharply, signaling strong selling pressure. Following this, the market broke the previous low, creating a Break of Structure (BOS) and confirming a shift to a downtrend.
The opportunity here is to place a sell limit order just below the IFVG, with a stop-loss above the previous high and a take-profit target at the most recent low. This trade setup provided a 3.3 to 1 reward-to-risk ratio.
Example 2

In this scenario, price first made a break of structure (BOS) to the downside, indicating the strength of sellers. It then retraced, sweeping buy-side liquidity before forming a bearish Inverse Fair Value Gap (IFVG)—a key zone for potential short entries. After that, the price dropped again, making another break of the structure, further confirming the bearish trend.
This setup had multiple confirmations, making it more likely to succeed. The trade involved placing a sell limit below the IFVG, with a stop-loss above the previous high and a take-profit at the recent low, offering a 2.25:1 risk-to-reward ratio.
Example 3

In this case, price initially made a Break of Structure (BOS) to the upside, confirming bullish intent. It then retraced, sweeping sell-side liquidity, and formed a bullish Inverse Fair Value Gap (IFVG)—a strong demand zone.
A Change of Character (CHOCH) followed, signaling a shift in momentum. The market then respected the bullish IFVG and pushed higher, reaching multiple take-profit (TP) levels.
This setup had strong confirmations:
- Liquidity sweep before the reversal
- CHOCH confirming trend shift
- Bullish IFVG acting as a demand zone
With these factors aligning, the probability of success increased, leading to a clean bullish move hitting TP 4.
In this case, you have multiple targets as price formed several internal highs that can be used as take-profit levels. Your risk management plan will determine how you approach these targets.
For better and safer results, you can take a portion of your profits at each potential TP level. For example:
- Take 40% of profits at TP1
- Take 30% of profits at TP2
- Take 20% of profits at TP3
- Take 10% of profits at TP4
This scaling-out method ensures you stay profitable even if the market reverses and hits your stop loss.
Final Thoughts
Incorporating Inversion Fair Value Gaps (IFVGs) into your trading strategy can provide traders with powerful tools for high-probability setups. While the concept of FVGs and IFVGs offers a structured approach to identifying potential market shifts, it's important to remember that no strategy is foolproof. A clear trading strategy, strict risk management, and a disciplined mindset are crucial to becoming a consistently profitable trader.
By combining IFVGs with trend analysis, liquidity, confirmation entries, and sound risk management, traders can refine their approach and enhance their chances of success, especially in challenging environments like prop firm trading. Always backtest your strategies and remain adaptable to changing market conditions to optimize your performance and ensure long-term profitability.
Take your trading to the next level with Top One Trader. The platform supports various strategies and provides educational resources to help you build and refine your own strategy. Start trading today and gain access to the tools and support needed for success!
-1%201%20(1).webp)